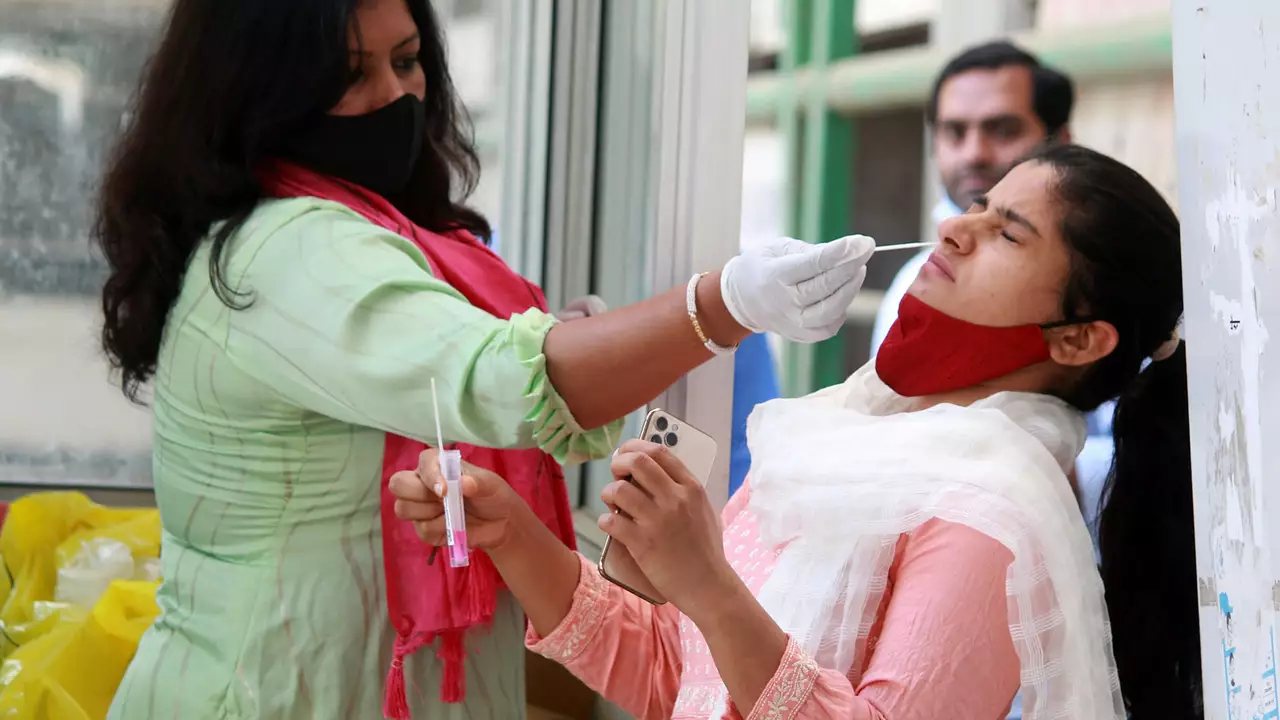
Infection Rate: What It Is and Why It Matters
When you hear about an infection rate, it’s basically a number that shows how fast a disease is spreading. A high rate means more people are getting sick each day, while a low rate signals the spread is slowing down. For anyone watching health news, this figure is a quick way to gauge risk.
How to Read Infection Rate Numbers
The most common method is to count new cases per 100,000 people over a 7‑day period. This smooths out daily spikes and gives a clearer picture. If a city reports a rate of 150, it means 150 new cases for every 100,000 residents in the last week. You’ll also see the rate expressed per day – that helps compare regions of different sizes.
Another tip: look at the trend, not just the single number. A rising curve warns of a coming surge, while a steady or falling line suggests control measures are working.
Using Infection Rate Data in Your Startup
Startups often think health data isn’t their concern, but the infection rate can affect staffing, supply chains, and customer behavior. If the rate spikes in a city where you have a warehouse, you might need extra safety gear or a backup plan for staff shortages.
Many founders tap into free dashboards from the Ministry of Health or use APIs that pull real‑time numbers. These tools let you set alerts – for example, trigger a notification when the rate crosses 200 in your operating region.
Take the case of a food‑delivery startup in Delhi. When the local infection rate shot up to 250, they switched to a contact‑less delivery model and offered PPE kits to riders. The move kept orders flowing and earned positive press.
Here are three quick steps to make the data work for you:
- Map the infection rate to each city you operate in.
- Set thresholds that automatically adjust staffing or inventory plans.
- Communicate changes to your team so everyone knows why decisions are made.
A common mistake is to rely on raw case counts without considering population size. A city with 10,000 cases might look scary, but if it has ten million people, the rate is low. Always convert to per‑100k before comparing.
Another pitfall is ignoring the lag between infection and reporting. The rate you see today reflects infections from a few days ago. Plan for a short delay when making immediate operational moves.
Looking ahead, more startups will embed infection‑rate analytics into their AI models. Predictive tools can forecast demand shifts or potential lockdown zones, giving you a head start on adjustments.
Bottom line: infection rate is a simple yet powerful metric. Keep an eye on it, use the right tools, and let the numbers guide practical decisions for your business.
Uttar Pradesh: No slowing of infection, Jhansi sees fresh uptick?
The situation in Uttar Pradesh, India, isn't showing signs of improvement as the infection rate continues to surge, with Jhansi experiencing a new increase in cases. Despite efforts to curb the spread, the battle against the virus seems to be far from over. The healthcare system is under immense pressure, constantly working to treat the afflicted and control the situation. This alarming trend is a reminder that we must continue implementing preventive measures diligently. It's a tough time, but we can only hope for improvement soon.
